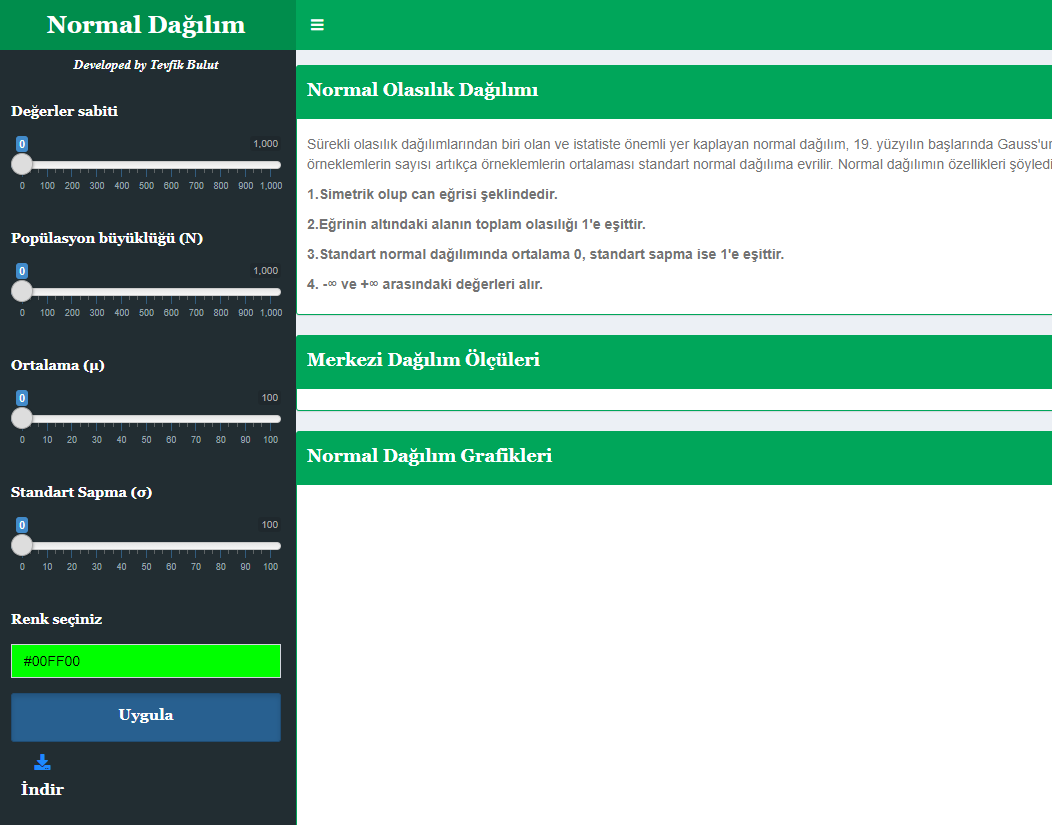
Bu çalışma kapsamında daha önce R’da yazıp Shiny üzerinde yayınladığım Normal dağılım simülasyonunun geliştirilmesinde kullandığım R kodları bütünleşik olarak paylaşılarak konu hakkında farkındalık oluşturulması amaçlanmıştır. Simülasyonda ayrıca üretilen veriyi csv formatında indirebilirsiniz de.
Geliştirdiğim uygulamaya aşağıdaki linkten ulaşabilirsiniz.
https://buluttevfik.shinyapps.io/normdv2/
Faydalı olması dileğiyle.
Bilimle ve teknolojiyle kalınız.
Not:
- Kaynak gösterilmeden alıntı yapılamaz veya kopyalanamaz.
- It can not be cited or copied without referencing.
Kütüphaneler ve R Kodları
library(shinydashboard)
library(shinydashboardPlus)
library(shiny)
library(ggthemes)
library(colourpicker)
library(tibble)
library(ggplot2)
library(pastecs)
library(psych)
library(ggpubr)
library(shinyWidgets)

ui<-dashboardPagePlus(skin = "green",
                      dashboardHeaderPlus(title = "Normal Dağılım", titleWidth = 300),
                      dashboardSidebar(width = 300,
                                       helpText(em(strong("Developed by Tevfik Bulut")), align = "center", style = "color:white; font-size: 10pt;font-family: Charm"),

                                       sliderInput(inputId="s", label=helpText(strong("Değerler sabiti"),style = "color:white;font-family: Georgia"),min=0, max=1000, value = 0),
                                       sliderInput(inputId="n", label=helpText(strong("Popülasyon büyüklüğü (N)"),style = "color:white;font-family: Georgia"),min=0, max=1000, value = 0),

                                       sliderInput(inputId="lb", label=helpText(strong("Ortalama (μ)"),style = "color:white;font-family: Georgia"),min=0, max=100, value = 0),


                                       sliderInput(inputId="sd", label= helpText(strong("Standart Sapma (σ)"),style = "color:white;font-family: Georgia"),min=0, max=100, value = 0),
                                       colourInput(inputId="color", label= helpText(strong("Renk seçiniz"),style = "color:white;font-family: Georgia"), value="Green"),
                                       actionButton(inputId = "cal" ,width =270 ,label =  helpText(strong("Uygula"),style = "color:white;font-family: Georgia"),style='padding:6px; font-size:110%', class="btn-primary btn-lg active"),

                                       downloadBttn("veri", label=helpText(strong("İndir"),style = "color:white;font-family: Georgia"),style="stretch",block = F, color="primary", size="sm")),
                      dashboardBody(
                        tags$head(tags$style(HTML('
                                                  .main-header .logo {
                                                  font-family: "Georgia", Times, "Times New Roman", serif;
                                                  font-weight: bold;
                                                  font-size: 24px;
                                                  }
                                                  '))),

                        fluidRow(
                          box(
                            title = helpText(strong("Normal Olasılık Dağılımı"),style = "color:white;font-family: Georgia"), status="success", solidHeader = TRUE,collapsible= TRUE,
                            width=300, helpText("Sürekli olasılık dağılımlarından biri olan ve istatiste önemli yer kaplayan normal dağılım, 19. yüzyılın başlarında Gauss'un katkılarıyla listeratürde yerini almıştır. Merkezi Timit Teoremi (Central Limit Theorem)'nin bir sonucudur. Popülasyondan çekilen örneklemlerin sayısı artıkça örneklemlerin ortalaması standart normal dağılıma evrilir. Normal dağılımın özellikleri şöyledir:"),
                            helpText(strong("1.Simetrik olup can eğrisi şeklindedir.")),
                            helpText(strong("2.Eğrinin altındaki alanın toplam olasılığı 1'e eşittir.")),
                            helpText(strong("3.Standart normal dağılımında ortalama 0, standart sapma ise 1'e eşittir.")),
                            helpText(strong("4. -∞ ve +∞ arasındaki değerleri alır."))
                          )),

                        fluidRow(
                          box(title = helpText(strong("Merkezi Dağılım Ölçüleri"), style = "color:white;font-family: Georgia"),status = "success", solidHeader = TRUE,width = 300,
                              collapsible = TRUE,
                              valueBoxOutput("vbox3", width=3),
                              valueBoxOutput("vbox4",width=3),
                              valueBoxOutput("vbox5",width=3),
                              valueBoxOutput("vbox6",width=3)

                          )),

                        fluidRow(
                          box(
                            title = helpText(strong("Normal Dağılım Grafikleri"), style = "color:white;font-family: Georgia"),status = "success", solidHeader = TRUE,width=300, height=700,
                            collapsible = TRUE,
                            plotOutput("box", height = 600))

                        )

                        )

                        )

server<-function(input, output){

  cast <- eventReactive(input$cal, {
    set.seed(input$s)
    y<-rnorm(input$n, input$lb, input$sd)
    tibble(v1=y)
  })


  output$box <- renderPlot({

    plot1<-ggplot(cast(), aes(x=v1)) +
      geom_histogram(position="identity", alpha=0.5, color="black", fill=input$color)+
      geom_vline(aes(xintercept=mean(v1)),
                 color="black", size=1)+
      geom_text(aes(x=mean(v1), label="μ", y=0), size=5, vjust=-0.4, hjust=-0.2, color="red")+
      geom_vline(aes(xintercept=sd(v1)),
                 color="black", size=1)+
      geom_text(aes(x=sd(v1), label="σ", y=0), size = 5,vjust=-0.4, hjust=-0.2, color="red")+
      labs(x="Değerler", y = "Frekans", title="Histogram")+
      theme(axis.title.x = element_text(size=14, colour="black", face="bold"))+
      theme(axis.title.y = element_text(size=14, colour="black", face="bold"))+
      scale_color_manual(values = c("#868686FF"))+
      theme_igray()

    plot2<- ggplot(cast(), aes(x=v1)) +
      geom_density(fill=input$color, alpha = 0.5)+
      geom_vline(aes(xintercept=mean(v1)),
                 color="black", size=1)+
      geom_text(aes(x=mean(v1), label="μ", y=0), size=5, vjust=-0.4, hjust=-0.2, color="red")+
      geom_vline(aes(xintercept=sd(v1)),
                 color="black", size=1)+
      geom_text(aes(x=sd(v1), label="σ", y=0), size = 5, vjust=-0.4, hjust=-0.2, color="red")+
      labs(x="Değerler", y = "Yoğunluk", title="Yoğunluk")+
      theme(axis.title.x = element_text(size=14, colour="black", face="bold"))+
      theme(axis.title.y = element_text(size=14, colour="black", face="bold"))+
      scale_color_manual(values = c("#868686FF"))+
      theme_igray()

    q<- ggqqplot(cast()$v1, xlab="",ylab = "Değerler", title="Q-Q Plot",  color= input$color)+
      font("ylab", size = 14, color = "black", face = "bold")+
      theme_igray()
    kutu<-ggplot(cast()) +
      aes(x = "", y = v1) +
      geom_boxplot(outlier.colour = "red", outlier.shape = 1, fill = input$color)+
      ggtitle("Kutu Diyagram")+
      ylab("Değerler")+
      xlab("")+
      theme(axis.title.y = element_text(size=14, colour="black", face="bold"))+
      stat_summary(
        aes(label = round(stat(y), 1)),
        geom = "text",
        fun.y = function(y) { o <- boxplot.stats(y)$out; if(length(o) == 0) NA else o },
        hjust = -1
      )+
      theme_igray()

    sekil<-ggarrange(plot1,plot2, q, kutu)
    annotate_figure(sekil,
                    top = text_grob(paste(paste("N=",input$n, sep=""),",", paste("μ=",input$lb, sep=""), ",", paste("σ=",input$sd, sep="")), color = "red", face = "bold", size = 16))
  })


  output$vbox3 <- renderValueBox({
    valueBox(color = "green",
             subtitle=strong("Varyans"),
             ifelse(is.na(var(cast()$v1)),"",round(var(cast()$v1),2)),
             icon = icon("stats",lib='glyphicon')
    )
  })


  output$vbox4 <- renderValueBox({
    valueBox(color = "green",
             subtitle=strong("Standart Hata"),
             ifelse(is.na(sd(cast()$v1)),"",round(sd(cast()$v1)/NROW(cast()$v1),2)),
             icon = icon("stats",lib='glyphicon')
    )
  })

  output$vbox5 <- renderValueBox({
    valueBox(color = "green",
             subtitle=strong("Çarpıklık"),
             ifelse(is.na(skew(cast()$v1)),"",round(skew(cast()$v1),2)),
             icon = icon("stats",lib='glyphicon')
    )
  })

  output$vbox6 <- renderValueBox({
    valueBox(color = "green",
             subtitle=strong("Basıklık"),
             ifelse(is.na(kurtosi(cast()$v1)),"",round(kurtosi(cast()$v1),2)),
             icon = icon("stats",lib='glyphicon')
    )
  })

  output$veri <- downloadHandler(
    filename = function() {
      paste("veri", ".csv", sep = "")
    },
    content = function(file) {
      write.csv(cast(), file, row.names = FALSE)
    }
  )

}
shinyApp(ui, server)
Uygulamanın Görüntüsü
