The main purpose of the study is to analysis Turkey earthquake data set obtained from AFAD (The Disaster and Emergency Management Presidency) online database using data mining techniques. In this way, it is targeted to be created awareness.
Loading Libraries
library(readr)
library(tibble)
library(tidyr)
library(dplyr)
library(lubridate)
library(formattable)
library(ggplot2)
library(ggpubr)
library(formattable)
library(GGally)
library(ggrepel)
Loading earthquage data set from year 1900 to date 2020-01-28
df<-read.csv("Catalogue2020.csv")

names(df)
##  [1] "No"                "Zaman..UTC."       "Ref1"
##  [4] "Kaynak.Aç.klama.1" "Enlem"             "Boylam"
##  [7] "Derinlik"          "Sabit.Derinlik"    "Kaynak.No.2"
## [10] "Kaynak.Aç.klama.2" "Tip"               "Büyüklük"
## [13] "Kaynak.No.3"       "Kaynak.Aç.klama.3" "Yer"
head(df)
##   No         Zaman..UTC. Ref1 Kaynak.Aç.klama.1   Enlem  Boylam Derinlik
## 1  0 2020-01-28 20:10:26    0                   39.0131 27.8700     5.08
## 2  0 2020-01-28 14:53:51    0                   39.0831 27.8295     7.00
## 3  0 2020-01-28 11:26:14    0                   39.1001 27.8411     6.98
## 4  0 2020-01-27 16:12:00    0                   38.3950 39.1333    11.94
## 5  0 2020-01-26 10:12:17    0                   38.4111 39.1530    12.25
## 6  0 2020-01-26 02:22:45    0                   38.2440 38.8013    12.52
##   Sabit.Derinlik Kaynak.No.2 Kaynak.Aç.klama.2 Tip Büyüklük Kaynak.No.3
## 1              -           7          AFAD-DDA  Mw      4.7           7
## 2              -           7          AFAD-DDA  Mw      4.1           7
## 3              -           7          AFAD-DDA  Mw      4.8           7
## 4              -           7          AFAD-DDA  Mw      4.2           7
## 5              -           7          AFAD-DDA  Mw      4.1           7
## 6              -           7          AFAD-DDA  Mw      4.3           7
##   Kaynak.Aç.klama.3 Yer
## 1          AFAD-DDA   -
## 2          AFAD-DDA   -
## 3          AFAD-DDA   -
## 4          AFAD-DDA   -
## 5          AFAD-DDA   -
## 6          AFAD-DDA   -
dim(df)
## [1] 6462 15
str(df)
## 'data.frame':    6462 obs. of  15 variables:
##  $ No               : int  0 0 0 0 0 0 0 0 0 0 ...
##  $ Zaman..UTC.      : Factor w/ 6462 levels "1900-01-18 15:30:00",..: 6462 6461 6460 6459 6458 6457 6456 6455 6454 6453 ...
##  $ Ref1             : int  0 0 0 0 0 0 0 0 0 0 ...
##  $ Kaynak.Aç.klama.1: Factor w/ 5 levels " ","Dakika ve saniye bilgisi yok",..: 1 1 1 1 1 1 1 1 1 1 ...
##  $ Enlem            : num  39 39.1 39.1 38.4 38.4 ...
##  $ Boylam           : num  27.9 27.8 27.8 39.1 39.2 ...
##  $ Derinlik         : num  5.08 7 6.98 11.94 12.25 ...
##  $ Sabit.Derinlik   : Factor w/ 2 levels "-","*": 1 1 1 1 1 1 1 1 1 1 ...
##  $ Kaynak.No.2      : int  7 7 7 7 7 7 7 7 7 7 ...
##  $ Kaynak.Aç.klama.2: Factor w/ 26 levels "AFAD-DDA","Alsan ve Di?.1975",..: 1 1 1 1 1 1 1 1 1 1 ...
##  $ Tip              : Factor w/ 8 levels "mb","md","Md",..: 7 7 7 7 7 7 7 7 7 7 ...
##  $ Büyüklük         : num  4.7 4.1 4.8 4.2 4.1 4.3 4.1 4.3 4.1 4.3 ...
##  $ Kaynak.No.3      : int  7 7 7 7 7 7 7 7 7 7 ...
##  $ Kaynak.Aç.klama.3: Factor w/ 32 levels "AFAD-DDA","Alsan ve Di?.1975",..: 1 1 1 1 1 1 1 1 1 1 ...
##  $ Yer              : Factor w/ 79 levels "-","?arköy-Tekirda?",..: 1 1 1 1 1 1 1 1 1 1 ...
Classification by year, yonth, day, hour, minute, and second
df1<-df[,c(2, 5, 6, 7, 12, 15)]

year<-tibble(Year=as.integer(year(df1$Zaman..UTC.)))

month<-tibble(Month=as.integer(month(df1$Zaman..UTC.)))

day<-tibble(Day=as.integer(day(df1$Zaman..UTC.)))

hour<-tibble(Hour=as.integer(hour(df1$Zaman..UTC.)))

minute<-tibble(Minute=as.integer(minute(df1$Zaman..UTC.)))

second<-tibble(Second=as.integer(second(df1$Zaman..UTC.)))

df2<-cbind(year, month, day, hour, minute, second, Latitude=as.numeric(df1[,2]),Longitude=as.numeric(df1[,3]), Depth= as.numeric(df1[,4]),Magnitute= as.numeric(df1[,5]), Place=as.character(df1[,6]))

df2<-as_tibble(df2)

str(df2)
## Classes 'tbl_df', 'tbl' and 'data.frame':    6462 obs. of  11 variables:
##  $ Year     : int  2020 2020 2020 2020 2020 2020 2020 2020 2020 2020 ...
##  $ Month    : int  1 1 1 1 1 1 1 1 1 1 ...
##  $ Day      : int  28 28 28 27 26 26 25 25 25 25 ...
##  $ Hour     : int  20 14 11 16 10 2 17 16 16 16 ...
##  $ Minute   : int  10 53 26 12 12 22 49 46 45 44 ...
##  $ Second   : int  26 51 14 0 17 45 47 58 6 23 ...
##  $ Latitude : num  39 39.1 39.1 38.4 38.4 ...
##  $ Longitude: num  27.9 27.8 27.8 39.1 39.2 ...
##  $ Depth    : num  5.08 7 6.98 11.94 12.25 ...
##  $ Magnitute: num  4.7 4.1 4.8 4.2 4.1 4.3 4.1 4.3 4.1 4.3 ...
##  $ Place    : Factor w/ 79 levels "-","?arköy-Tekirda?",..: 1 1 1 1 1 1 1 1 1 1 ...
#Removing rows including irrelevant records

c<-as.vector(which(df2$Place=="Gürcistan"))
d<-as.vector(which(df2$Place=="Rodos Adas?"))
e<-as.vector(which(df2$Place=="Yunanistan"))
f<-as.vector(which(df2$Place=="?ran"))
g<-as.vector(which(df2$Place=="Yunaistan"))

df2<-df2[-c(c,d,e,f,g),]

str(df2)
## Classes 'tbl_df', 'tbl' and 'data.frame':    6455 obs. of  11 variables:
##  $ Year     : int  2020 2020 2020 2020 2020 2020 2020 2020 2020 2020 ...
##  $ Month    : int  1 1 1 1 1 1 1 1 1 1 ...
##  $ Day      : int  28 28 28 27 26 26 25 25 25 25 ...
##  $ Hour     : int  20 14 11 16 10 2 17 16 16 16 ...
##  $ Minute   : int  10 53 26 12 12 22 49 46 45 44 ...
##  $ Second   : int  26 51 14 0 17 45 47 58 6 23 ...
##  $ Latitude : num  39 39.1 39.1 38.4 38.4 ...
##  $ Longitude: num  27.9 27.8 27.8 39.1 39.2 ...
##  $ Depth    : num  5.08 7 6.98 11.94 12.25 ...
##  $ Magnitute: num  4.7 4.1 4.8 4.2 4.1 4.3 4.1 4.3 4.1 4.3 ...
##  $ Place    : Factor w/ 79 levels "-","?arköy-Tekirda?",..: 1 1 1 1 1 1 1 1 1 1 ...
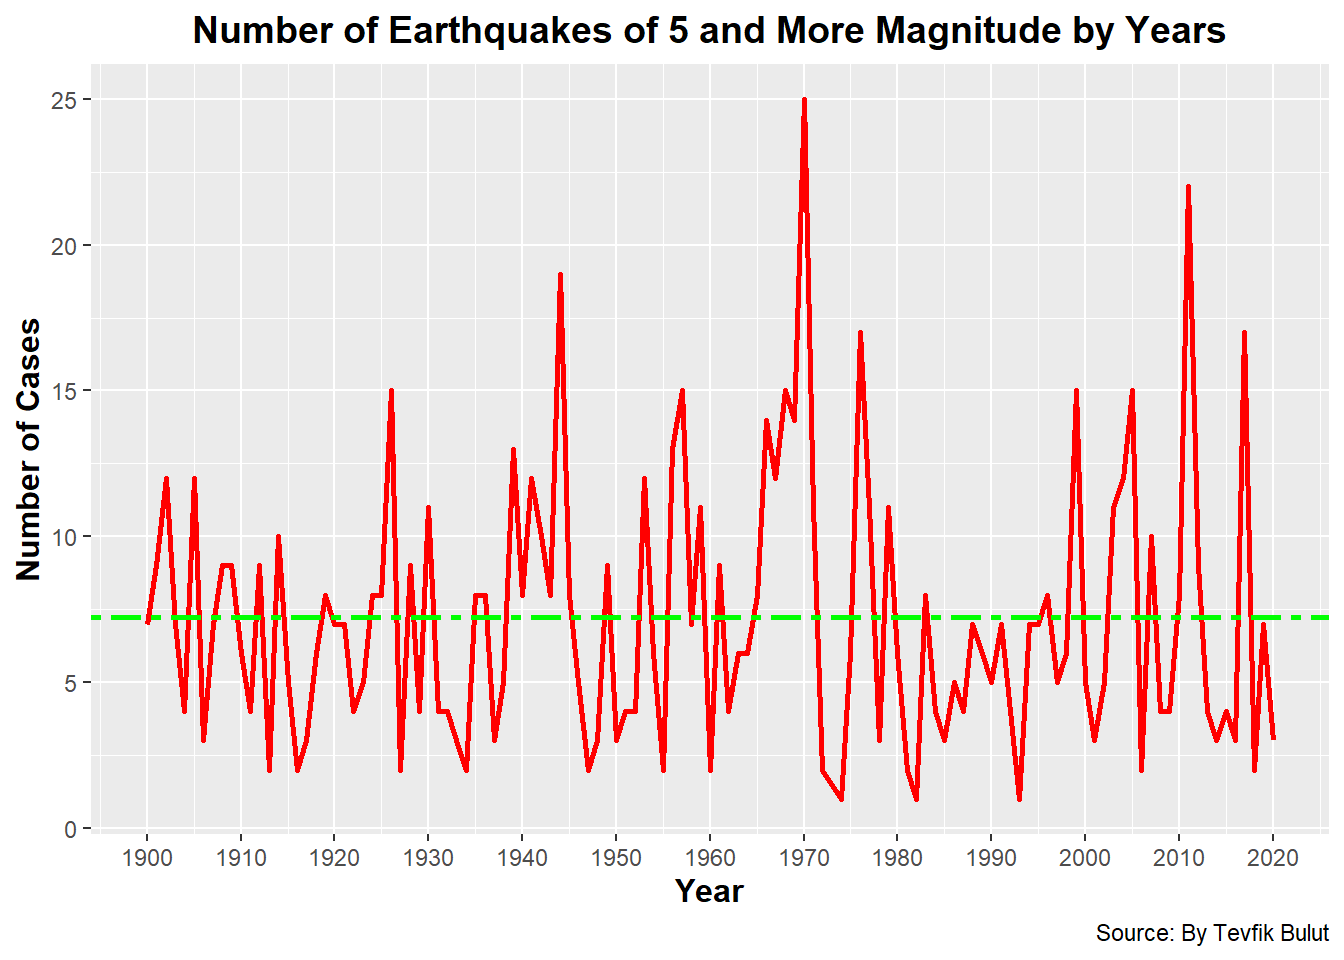
Number of earthquakes of 5 and more magnitude by years
year<-df2 %>% filter (Magnitute>4.99) %>% group_by(Year) %>% tally()

formattable (year)
Year	n
1900	7
1901	9
1902	12
1903	7
1904	4
1905	12
1906	3
1907	7
1908	9
1909	9
1910	6
1911	4
1912	9
1913	2
1914	10
1915	5
1916	2
1917	3
1918	6
1919	8
1920	7
1921	7
1922	4
1923	5
1924	8
1925	8
1926	15
1927	2
1928	9
1929	4
1930	11
1931	4
1932	4
1933	3
1934	2
1935	8
1936	8
1937	3
1938	5
1939	13
1940	8
1941	12
1942	10
1943	8
1944	19
1945	8
1946	5
1947	2
1948	3
1949	9
1950	3
1951	4
1952	4
1953	12
1954	6
1955	2
1956	13
1957	15
1958	7
1959	11
1960	2
1961	9
1962	4
1963	6
1964	6
1965	8
1966	14
1967	12
1968	15
1969	14
1970	25
1971	11
1972	2
1974	1
1975	6
1976	17
1977	11
1978	3
1979	11
1980	6
1981	2
1982	1
1983	8
1984	4
1985	3
1986	5
1987	4
1988	7
1989	6
1990	5
1991	7
1992	4
1993	1
1994	7
1995	7
1996	8
1997	5
1998	6
1999	15
2000	5
2001	3
2002	5
2003	11
2004	12
2005	15
2006	2
2007	10
2008	4
2009	4
2010	8
2011	22
2012	9
2013	4
2014	3
2015	4
2016	3
2017	17
2018	2
2019	7
2020	3
year%>%ggplot(aes(Year, n))+
      geom_line(size=1, col="red")+
      scale_x_continuous(breaks=seq(min(year$Year),max(year$Year), 10))+
      ggtitle("Number of Earthquakes of 5 and More Magnitude by Years") +
      xlab("Year") + ylab("Number of Cases")+
      labs(caption = "Source: By Tevfik Bulut")+
      theme(plot.title = element_text(family = "Trebuchet MS", face="bold",
            size=14, hjust=0.5)) +
      theme(axis.title = element_text(family = "Trebuchet MS", face="bold",
            size=12))+
      geom_hline(yintercept=mean(year$n), linetype="twodash", color =
                 "green", size=1)
Number of earthquakes of 6 and more magnitude by years
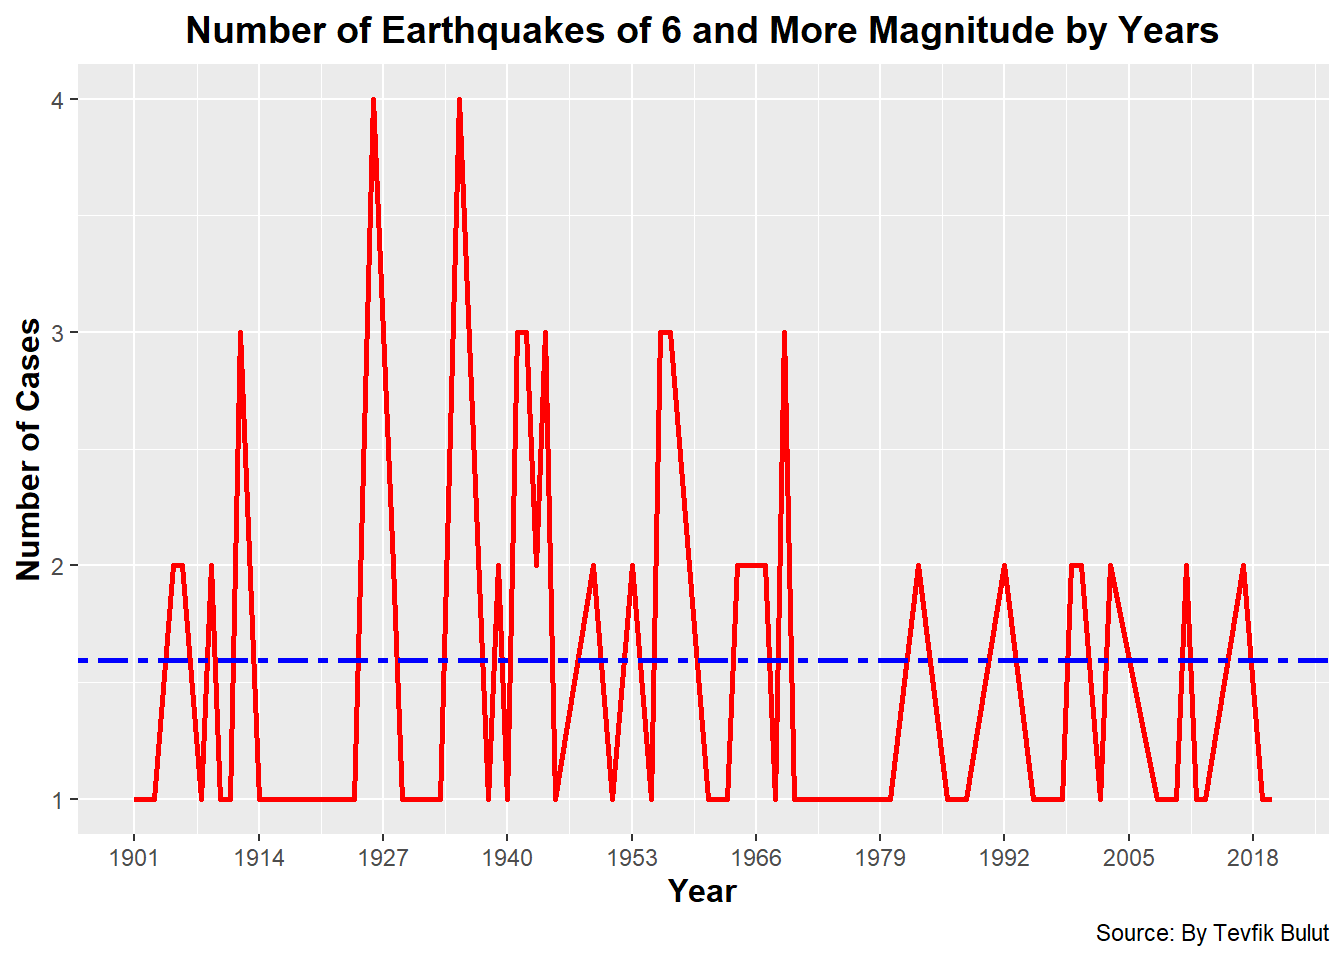
year<-df2 %>% filter (Magnitute>5.99) %>% group_by(Year) %>% tally()

year%>%ggplot(aes(Year, n))+
geom_line(size=1, col="red")+
  scale_x_continuous(breaks=seq(min(year$Year),max(year$Year), 13))+
   ggtitle("Number of Earthquakes of 6 and More Magnitude by Years") +
           xlab("Year") + ylab("Number of Cases")+
  labs(caption = "Source: By Tevfik Bulut")+
  theme(plot.title = element_text(family = "Trebuchet MS", face="bold", size=14, hjust=0.5)) +
theme(axis.title = element_text(family = "Trebuchet MS", face="bold", size=12))+
 geom_hline(yintercept=mean(year$n), linetype="twodash", color = "blue", size=1)
Number of earthquakes of 7 and more magnitude by years
year<-df2 %>% filter (Magnitute>6.99) %>% group_by(Year) %>% tally()

year%>%ggplot(aes(Year, n))+
geom_point(size=1, col="red")+
   ggtitle("Number of Earthquakes of 7 and More Magnitude by Years") +
           xlab("") + ylab("Number of Cases")+
  labs(caption = "Source: By Tevfik Bulut")+
  theme(plot.title = element_text(family = "Trebuchet MS", face="bold", size=14, hjust=0.5)) +
theme(axis.title = element_text(family = "Trebuchet MS", face="bold", size=12))+
geom_text_repel(aes(label=Year), size=3, data=year) + theme(legend.position = "None")

Number of cases by months
month<-df2 %>% group_by(Month) %>% tally()

formattable (month)
Month	n
1	518
2	431
3	564
4	557
5	644
6	485
7	568
8	573
9	465
10	620
11	550
12	480
month<-month %>% select(Month, n)%>%
                 arrange(desc(n))
month
##    Month     n
##  1     5   644
##  2    10   620
##  3     8   573
##  4     7   568
##  5     3   564
##  6     4   557
##  7    11   550
##  8     1   518
##  9     6   485
## 10    12   480
## 11     9   465
## 12     2   431
month %>% ggplot(aes(Month, n))+
geom_line(size=1, col="brown")+
  scale_x_continuous(breaks=seq(1, 12, 1))+
   ggtitle("Number of Cases by Months") +
           xlab("Month") + ylab("Number of Cases")+
  labs(caption = "Source: By Tevfik Bulut")+
  theme(plot.title = element_text(family = "Trebuchet MS", face="bold", size=14, hjust=0.5)) +
theme(axis.title = element_text(family = "Trebuchet MS", face="bold", size=12))+
  geom_hline(yintercept=mean(month$n), linetype="twodash", color = "red", size=1)

Number of earthquakes of 6 and more magnitude by months
month<-df2 %>% filter (Magnitute>5.99) %>% group_by(Month) %>% tally()

month%>%ggplot(aes(Month, n))+
geom_line(size=1, col="red")+
  scale_x_continuous(breaks=seq(1, 12, 1))+
   ggtitle("Number of Earthquakes of 6 and More Magnitudes by Months") +
           xlab("") + ylab("Number of Cases")+
  labs(caption = "Source: By Tevfik Bulut")+
  theme(plot.title = element_text(family = "Trebuchet MS", face="bold", size=14, hjust=0.5)) +
theme(axis.title = element_text(family = "Trebuchet MS", face="bold", size=12))+
  geom_hline(yintercept=mean(month$n), linetype="twodash", color = "blue", size=1)

Number of earthquakes of range from 7 to 8 magnitudes by months
month<-df2 %>% filter (between(Magnitute, 7, 8)) %>% group_by(Month) %>% tally()

month%>%ggplot(aes(Month, n))+
geom_line(size=1, col="red")+
  scale_x_continuous(breaks=seq(1, 12, 1))+
   ggtitle("Number of Earthquakes of 7 and 8 Magnitudes by Months") +
           xlab("") + ylab("Number of Cases")+
  labs(caption = "Source: By Tevfik Bulut")+
  theme(plot.title = element_text(family = "Trebuchet MS", face="bold", size=14, hjust=0.5)) +
theme(axis.title = element_text(family = "Trebuchet MS", face="bold", size=12))+
  geom_hline(yintercept=mean(month$n), linetype="twodash", color = "green", size=1)

Number of cases by hour
hour<-df2 %>% group_by(Hour) %>% tally()

formattable (hour)
Hour	n
0	343
1	267
2	292
3	271
4	278
5	275
6	243
7	257
8	254
9	267
10	265
11	271
12	242
13	238
14	262
15	254
16	273
17	278
18	275
19	261
20	280
21	272
22	285
23	252
hour<-hour %>% select(Hour, n)%>%
      arrange(desc(n))
hour
##     Hour     n
##  1     0   343
##  2     2   292
##  3    22   285
##  4    20   280
##  5     4   278
##  6    17   278
##  7     5   275
##  8    18   275
##  9    16   273
## 10    21   272
## # … with 14 more rows
hour %>% ggplot(aes(Hour, n))+
geom_line(size=1, col="red")+
  scale_x_continuous(breaks=seq(0, 24, 2))+
   ggtitle("Number of Cases by Hour") +
           xlab("Time") + ylab("Number of Cases")+
  labs(caption = "Source: By Tevfik Bulut")+
  theme(plot.title = element_text(family = "Trebuchet MS", face="bold", size=14, hjust=0.5)) +
theme(axis.title = element_text(family = "Trebuchet MS", face="bold", size=12))+
  geom_hline(yintercept=mean(hour$n), linetype="twodash", color = "blue", size=1)

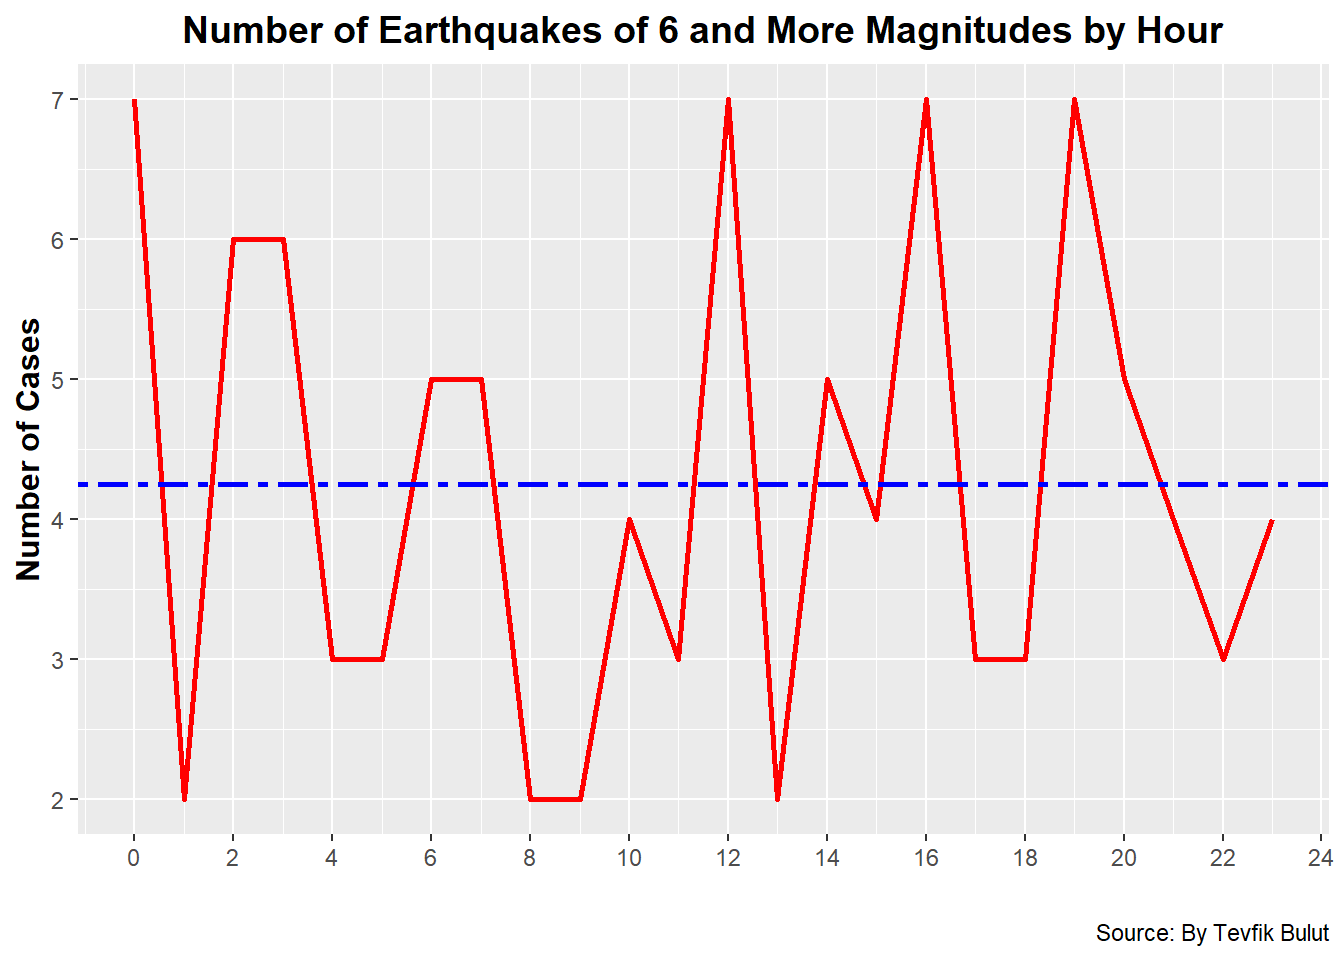
Number of earthquakes of 6 and more magnitudes by hour
hour<-df2 %>% filter (Magnitute>5.99) %>% group_by(Hour) %>% tally()

hour%>%ggplot(aes(Hour, n))+
geom_line(size=1, col="red")+
  scale_x_continuous(breaks=seq(0, 24, 2))+
   ggtitle("Number of Earthquakes of 6 and More Magnitudes by Hour") +
           xlab("") + ylab("Number of Cases")+
  labs(caption = "Source: By Tevfik Bulut")+
  theme(plot.title = element_text(family = "Trebuchet MS", face="bold", size=14, hjust=0.5)) +
theme(axis.title = element_text(family = "Trebuchet MS", face="bold", size=12))+
  geom_hline(yintercept=mean(hour$n), linetype="twodash", color = "blue", size=1)
Number of earthquakes of range from 6 to 8 magnitudes by hour
hour<-df2 %>% filter (between (Magnitute, 6, 8)) %>% group_by(Hour) %>% tally()

hour%>%ggplot(aes(Hour, n))+
geom_line(size=1, col="red")+
  scale_x_continuous(breaks=seq(0, 24, 2))+
   ggtitle("Number of Earthquakes of 6 and 8 Magnitudes by Hour") +
           xlab("") + ylab("Number of Cases")+
  labs(caption = "Source: By Tevfik Bulut")+
  theme(plot.title = element_text(family = "Trebuchet MS", face="bold", size=14, hjust=0.5)) +
theme(axis.title = element_text(family = "Trebuchet MS", face="bold", size=12))

Number of earthquakes of 7 and more magnitudes by hour
hour<-df2 %>% filter (Magnitute>6.99) %>% group_by(Hour) %>% tally()

hour%>%ggplot(aes(Hour, n))+
geom_line(size=1, col="red")+
  scale_x_continuous(breaks=seq(0, 24, 2))+
   ggtitle("Number of Earthquakes of 7 and More Magnitudes by Hour") +
           xlab("") + ylab("Number of Cases")+
  labs(caption = "Source: By Tevfik Bulut")+
  theme(plot.title = element_text(family = "Trebuchet MS", face="bold", size=14, hjust=0.5)) +
theme(axis.title = element_text(family = "Trebuchet MS", face="bold", size=12))+
  geom_hline(yintercept=mean(hour$n), linetype="twodash", color = "blue", size=1)

Earthquages by magnitutes
df2 %>% ggplot(aes(x=seq_along(df2$Magnitute), y=df2$Magnitute))+
 geom_point(col="red")+
   ggtitle("Earhtquages by Magnitudes") +
           xlab("") + ylab("Magnitude")+
  labs(caption = "Source: By Tevfik Bulut")+
  theme(plot.title = element_text(family = "Trebuchet MS", face="bold", size=14, hjust=0.5)) +
theme(axis.title = element_text(family = "Trebuchet MS", face="bold", size=12))+
  geom_hline(yintercept=mean(df2$Magnitute), linetype="twodash", color = "blue", size=1)

Earthquages of magnitutes by years
df2 %>% ggplot(aes(x=Year, y=Magnitute))+
 geom_point(col="red")+
   ggtitle("Magnitudes of Earhtquages by Years") +
           xlab("Year") + ylab("Magnitude")+
  labs(caption = "Source: By Tevfik Bulut")+
  theme(plot.title = element_text(family = "Trebuchet MS", face="bold", size=14, hjust=0.5)) +
theme(axis.title = element_text(family = "Trebuchet MS", face="bold", size=12))+
  geom_hline(yintercept=mean(df2$Magnitute), linetype="twodash", color = "blue", size=1)

Earthquages of magnitudes (>=5) by years
m5<-df2 %>% filter(Magnitute>4.99)%>% select(Place, Year, Magnitute)%>%
  arrange(desc(Magnitute))

m5 %>% ggplot(aes(x=Year, y=Magnitute))+
 geom_point(col="red")+
   ggtitle("Magnitudes (>=5) of Earhtquages by Years") +
           xlab("Year") + ylab("Magnitude")+
  labs(caption = "Source: By Tevfik Bulut")+
  theme(plot.title = element_text(family = "Trebuchet MS", face="bold", size=14, hjust=0.5)) +
theme(axis.title = element_text(family = "Trebuchet MS", face="bold", size=12))+
  geom_hline(yintercept=mean(m5$Magnitute), linetype="twodash", color = "blue", size=1)

Earthquages of magnitutes (>=6) by years
m6<-df2 %>% filter(Magnitute>5.99)%>% select(Place, Year, Magnitute)%>%
  arrange(desc(Magnitute))

m6 %>% ggplot(aes(x=Year, y=Magnitute))+
 geom_point(col="red")+
   ggtitle("Magnitutes (>=6) of Earhtquages by Years") +
           xlab("Year") + ylab("Magnitude")+
  labs(caption = "Source: By Tevfik Bulut")+
  theme(plot.title = element_text(family = "Trebuchet MS", face="bold", size=14, hjust=0.5)) +
theme(axis.title = element_text(family = "Trebuchet MS", face="bold", size=12))+
  geom_hline(yintercept=mean(m6$Magnitute), linetype="twodash", color = "blue", size=1)

Earthquages of magnitutes (>=7) by years
m7<-df2 %>% filter(Magnitute>6.99)%>% select(Place, Year, Magnitute)%>%
  arrange(desc(Magnitute))

m7 %>% ggplot(aes(x=Year, y=Magnitute))+
 geom_point(size=1, col="red")+
   ggtitle("Magnitutes (>=7) of Earhtquages by Years") +
           xlab("") + ylab("Magnitude")+
  labs(caption = "Source: By Tevfik Bulut")+
  theme(plot.title = element_text(family = "Trebuchet MS", face="bold", size=14, hjust=0.5)) +
theme(axis.title = element_text(family = "Trebuchet MS", face="bold", size=12))+
  geom_hline(yintercept=mean(m7$Magnitute), linetype="twodash", color = "blue", size=1)+
geom_text_repel(aes(label=Year), size=3, data=m7) + theme(legend.position = "None")

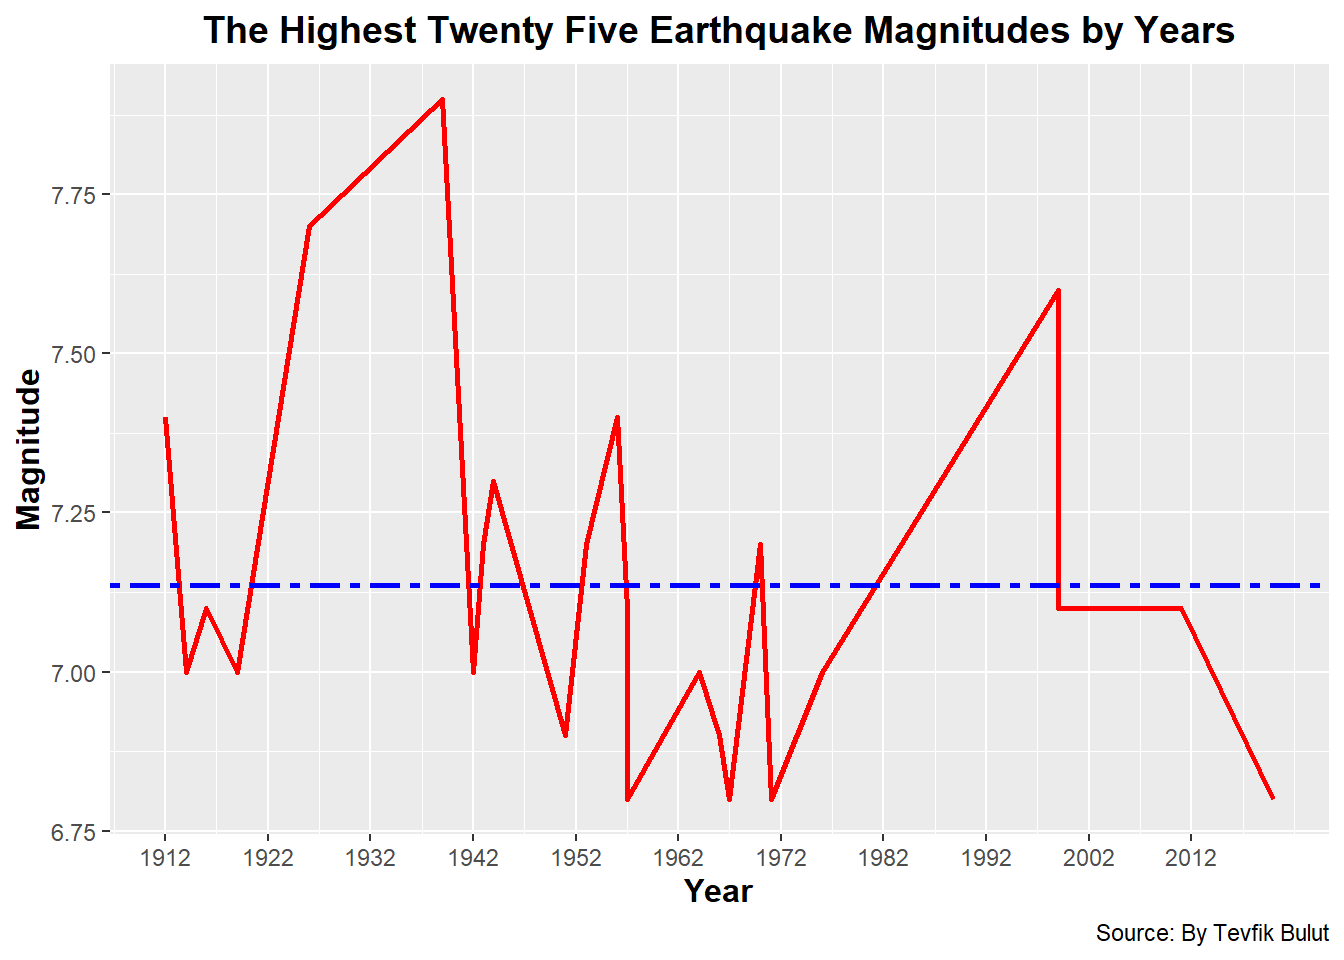
The highest twenty five earthquake magnitudes by years
hm<-df2 %>% select(Year, Magnitute)%>%
  arrange(desc(Magnitute))

hm_25<-head(hm,25)

hm_25 %>% ggplot(aes(Year, Magnitute))+
geom_line(size=1, col="red")+
  scale_x_continuous(breaks=seq(min(hm_25$Year),max(hm_25$Year), 10))+
   ggtitle("The Highest Twenty Five Earthquake Magnitudes by Years") +
           xlab("Year") + ylab("Magnitude")+
  labs(caption = "Source: By Tevfik Bulut")+
  theme(plot.title = element_text(family = "Trebuchet MS", face="bold", size=14, hjust=0.5)) +
theme(axis.title = element_text(family = "Trebuchet MS", face="bold", size=12))+
  geom_hline(yintercept=mean(hm_25$Magnitute), linetype="twodash", color = "blue", size=1)
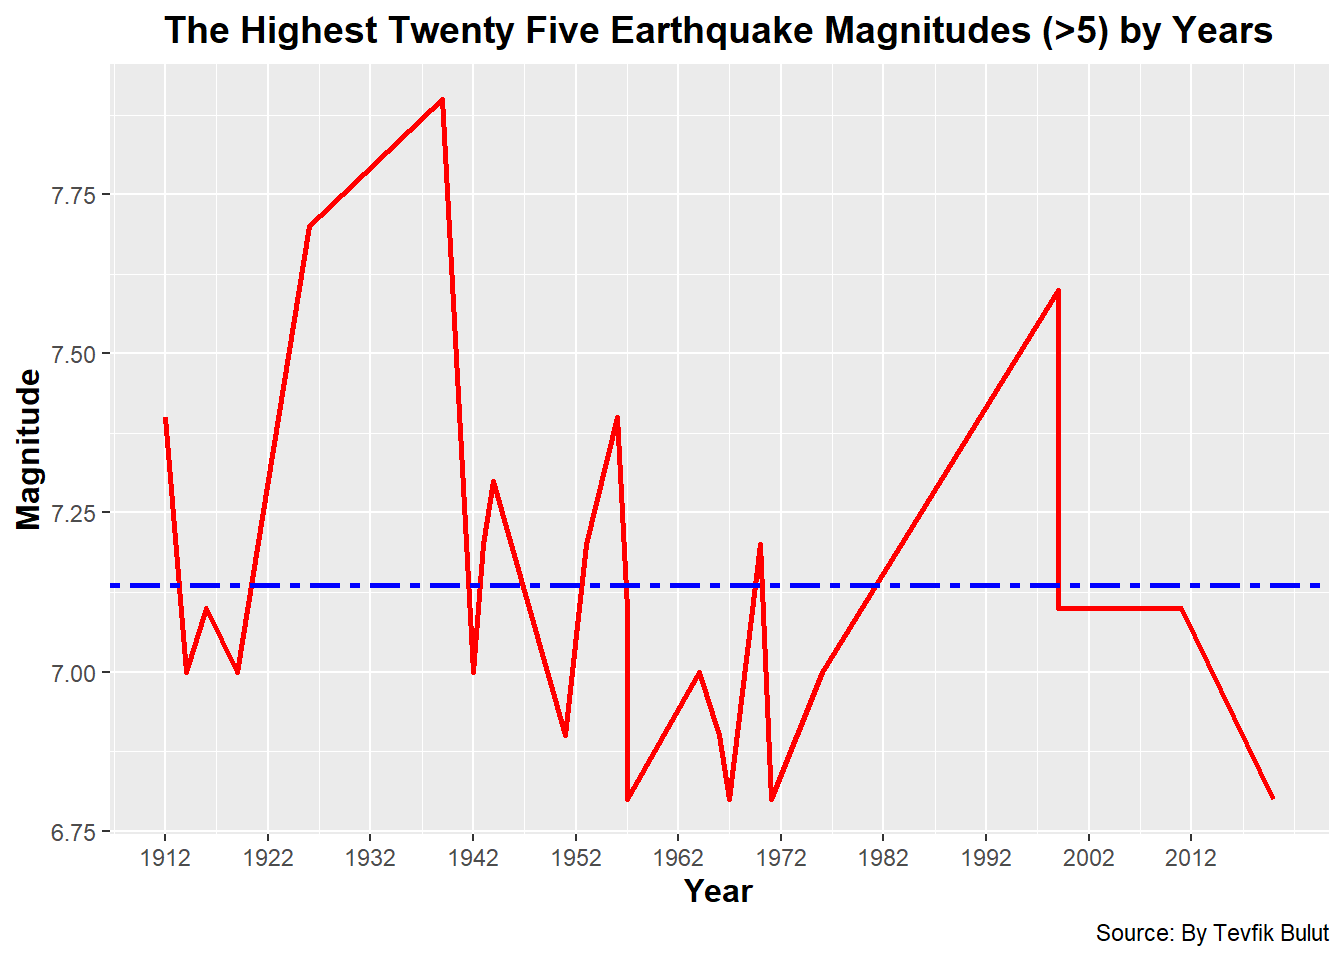
The highest twenty five earthquake magnitudes (>5) by years
mag_5<-df2 %>% filter(Magnitute>5)%>% select(Year, Magnitute)%>%
               arrange(desc(Magnitute))

mag_25<-head(mag_5,25)

mag_25
##     Year Magnitute
##  1  1939       7.9
##  2  1926       7.7
##  3  1999       7.6
##  4  1956       7.4
##  5  1912       7.4
##  6  1944       7.3
##  7  1970       7.2
##  8  1953       7.2
##  9  1943       7.2
## 10  2011       7.1
## # … with 15 more rows
mag_25 %>% ggplot(aes(Year, Magnitute))+
geom_line(size=1, col="red")+
  scale_x_continuous(breaks=seq(min(mag_25$Year),max(mag_25$Year), 10))+
   ggtitle("The Highest Twenty Five Earthquake Magnitudes (>5) by Years") +
           xlab("Year") + ylab("Magnitude")+
  labs(caption = "Source: By Tevfik Bulut")+
  theme(plot.title = element_text(family = "Trebuchet MS", face="bold", size=14, hjust=0.5)) +
theme(axis.title = element_text(family = "Trebuchet MS", face="bold", size=12))+
  geom_hline(yintercept=mean(mag_25$Magnitute), linetype="twodash", color = "blue", size=1)
The highest twenty five earthquake magnitudes (>6) by years
mag_6<-df2 %>% filter(Magnitute>6)%>% select(Place, Year, Magnitute)%>%
                     arrange(desc(Magnitute))

mag_25<-head(mag_6,25)

mag_25
##    Place                    Year Magnitute
##  1 Erzican                  1939       7.9
##  2 Datça Aç?klar?-Ege Dizi  1926       7.7
##  3 Gölcük-Kocaeli           1999       7.6
##  4 Ege Denizi               1956       7.4
##  5 ?arköy-Tekirda?          1912       7.4
##  6 Gerede-Bolu              1944       7.3
##  7 Kütahya                  1970       7.2
##  8 Çanakkale                1953       7.2
##  9 Ilgaz-Çak?r?             1943       7.2
## 10 Van-Merkez               2011       7.1
## # … with 15 more rows
mag_25 %>% ggplot(aes(Year, Magnitute))+
geom_line(size=1, col="red")+
  scale_x_continuous(breaks=seq(min(mag_25$Year),max(mag_25$Year), 10))+
   ggtitle("The Highest Twenty Five Earthquake Magnitudes (>6) by Years") +
           xlab("Year") + ylab("Magnitude")+
  labs(caption = "Source: By Tevfik Bulut")+
  theme(plot.title = element_text(family = "Trebuchet MS", face="bold", size=14, hjust=0.5)) +
theme(axis.title = element_text(family = "Trebuchet MS", face="bold", size=12))+
  geom_hline(yintercept=mean(mag_25$Magnitute), linetype="twodash", color = "green", size=1)

The highest twenty five earthquake magnitudes (>7) by years
mag_7<-df2 %>% filter(Magnitute>7)%>% select(Place, Year, Magnitute)%>%
                      arrange(desc(Magnitute))

mag_25<-head(mag_7,15)

mag_25
##    Place                    Year Magnitute
##  1 Erzican                  1939       7.9
##  2 Datça Aç?klar?-Ege Dizi  1926       7.7
##  3 Gölcük-Kocaeli           1999       7.6
##  4 Ege Denizi               1956       7.4
##  5 ?arköy-Tekirda?          1912       7.4
##  6 Gerede-Bolu              1944       7.3
##  7 Kütahya                  1970       7.2
##  8 Çanakkale                1953       7.2
##  9 Ilgaz-Çak?r?             1943       7.2
## 10 Van-Merkez               2011       7.1
## 11 Düzce-Bolu               1999       7.1
## 12 Düzce-Bolu               1957       7.1
## 13 Akdeniz                  1957       7.1
## 14 Tokat                    1916       7.1
mag_25 %>% ggplot(aes(Year, Magnitute))+
geom_line(size=1, col="red")+
   ggtitle("The Highest Twenty Five Earthquake Magnitudes (>7) by Years") +
           xlab("Year") + ylab("Magnitude")+
  labs(caption = "Source: By Tevfik Bulut")+
  theme(plot.title = element_text( family="American Typewriter", face="bold", size=14, hjust=0.5)) +
theme(axis.title = element_text(family = "Trebuchet MS", face="bold", size=12))+
  geom_hline(yintercept=mean(mag_25$Magnitute), linetype="twodash", color = "blue", size=1)+
geom_text_repel(aes(label=Year), size=3, data=mag_25) + theme(legend.position = "None")

Earthquages of magnitutes (>=5) by month
m5<-df2 %>% filter(Magnitute>4.99)%>% select(Place, Month, Magnitute)%>%
  arrange(desc(Magnitute))

m5 %>% ggplot(aes(x=Month, y=Magnitute))+
 geom_point(col="red")+
  scale_x_continuous(breaks=seq(1, 12, 1))+
   ggtitle("Magnitudes (>=5) of Earhtquages by Month") +
           xlab("Month") + ylab("Magnitude")+
  labs(caption = "Source: By Tevfik Bulut")+
  theme(plot.title = element_text(family = "Trebuchet MS", face="bold", size=14, hjust=0.5)) +
theme(axis.title = element_text(family = "Trebuchet MS", face="bold", size=12))+
  geom_hline(yintercept=mean(m5$Magnitute), linetype="twodash", color = "blue", size=1)

Earthquages of magnitudes (>=6) by month
m6<-df2 %>% filter(Magnitute>5.99)%>% select(Place, Month, Magnitute)%>%
  arrange(desc(Magnitute))

m6 %>% ggplot(aes(x=Month, y=Magnitute))+
 geom_point(col="red")+
  scale_x_continuous(breaks=seq(1, 12, 1))+
   ggtitle("Magnitudes (>=6) of Earhtquages by Month") +
           xlab("Month") + ylab("Magnitude")+
  labs(caption = "Source: By Tevfik Bulut")+
  theme(plot.title = element_text(family = "Trebuchet MS", face="bold", size=14, hjust=0.5)) +
theme(axis.title = element_text(family = "Trebuchet MS", face="bold", size=12))+
  geom_hline(yintercept=mean(m6$Magnitute), linetype="twodash", color = "blue", size=1)

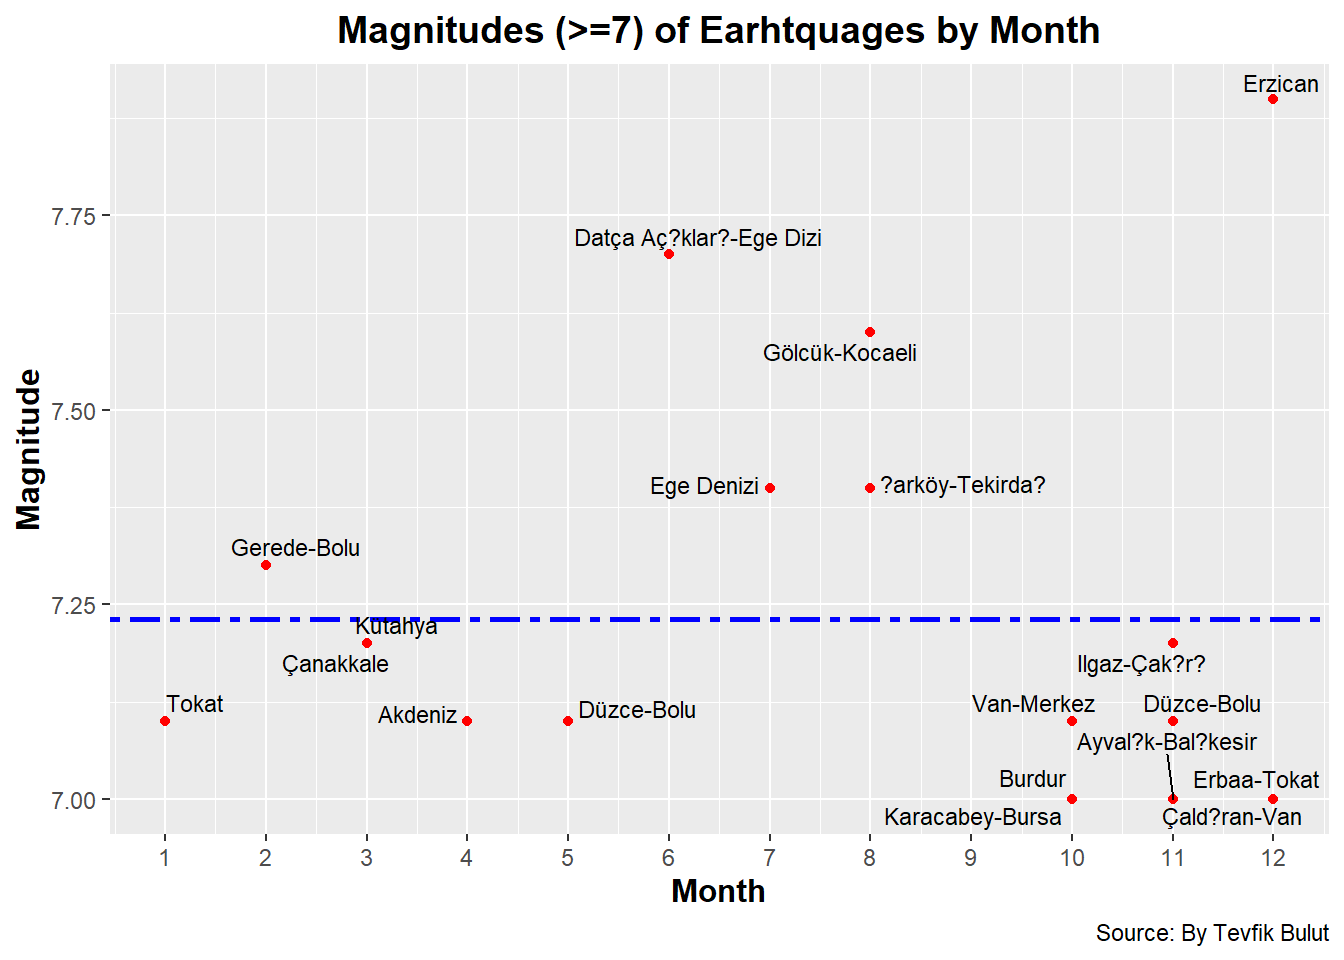
Earthquages of magnitudes (>=7) by month
m7<-df2 %>% filter(Magnitute>6.99)%>% select(Place, Month, Magnitute)%>%
  arrange(desc(Magnitute))
m7
##    Place                   Month Magnitute
##  1 Erzican                    12       7.9
##  2 Datça Aç?klar?-Ege Dizi     6       7.7
##  3 Gölcük-Kocaeli              8       7.6
##  4 Ege Denizi                  7       7.4
##  5 ?arköy-Tekirda?             8       7.4
##  6 Gerede-Bolu                 2       7.3
##  7 Kütahya                     3       7.2
##  8 Çanakkale                   3       7.2
##  9 Ilgaz-Çak?r?               11       7.2
## 10 Van-Merkez                 10       7.1
## 11 Düzce-Bolu                 11       7.1
## 12 Düzce-Bolu                  5       7.1
## 13 Akdeniz                     4       7.1
## 14 Tokat                       1       7.1
## 15 Çald?ran-Van               11       7
## 16 Karacabey-Bursa            10       7
## 17 Erbaa-Tokat                12       7
## 18 Ayval?k-Bal?kesir          11       7
## 19 Burdur                     10       7
m7 %>% ggplot(aes(x=Month, y=Magnitute))+
 geom_point(col="red")+
  scale_x_continuous(breaks=seq(1, 12, 1))+
   ggtitle("Magnitudes (>=7) of Earhtquages by Month") +
           xlab("Month") + ylab("Magnitude")+
  labs(caption = "Source: By Tevfik Bulut")+
  theme(plot.title = element_text(family = "Trebuchet MS", face="bold", size=14, hjust=0.5)) +
theme(axis.title = element_text(family = "Trebuchet MS", face="bold", size=12))+
  geom_hline(yintercept=mean(m7$Magnitute), linetype="twodash", color = "blue", size=1)+
geom_text_repel(aes(label=Place), size=3, data=m7) + theme(legend.position = "None")
Earthquages of magnitudes (>=5) by hour
h5<-df2 %>% filter(Magnitute>4.99)%>% select(Place, Hour, Magnitute)%>%
  arrange(desc(Magnitute))

h5 %>% ggplot(aes(x=Hour, y=Magnitute))+
 geom_point(col="red")+
  scale_x_continuous(breaks=seq(0, 24, 2))+
   ggtitle("Magnitudes (>=5) of Earhtquages by Hour") +
           xlab("Hour") + ylab("Magnitude")+
  labs(caption = "Source: By Tevfik Bulut")+
  theme(plot.title = element_text(family = "Trebuchet MS", face="bold", size=14, hjust=0.5)) +
theme(axis.title = element_text(family = "Trebuchet MS", face="bold", size=12))+
  geom_hline(yintercept=mean(h5$Magnitute), linetype="twodash", color = "blue", size=1)

Earthquages of magnitutes (>=6) by hour
h6<-df2 %>% filter(Magnitute>5.99)%>% select(Place, Hour, Magnitute)%>%
  arrange(desc(Magnitute))

h6 %>% ggplot(aes(x=Hour, y=Magnitute))+
 geom_point(col="red")+
  scale_x_continuous(breaks=seq(0, 24, 2))+
   ggtitle("Magnitudes (>=6) of Earhtquages by Hour") +
           xlab("Hour") + ylab("Magnitude")+
  labs(caption = "Source: By Tevfik Bulut")+
  theme(plot.title = element_text(family = "Trebuchet MS", face="bold", size=14, hjust=0.5)) +
theme(axis.title = element_text(family = "Trebuchet MS", face="bold", size=12))+
  geom_hline(yintercept=mean(h6$Magnitute), linetype="twodash", color = "blue", size=1)

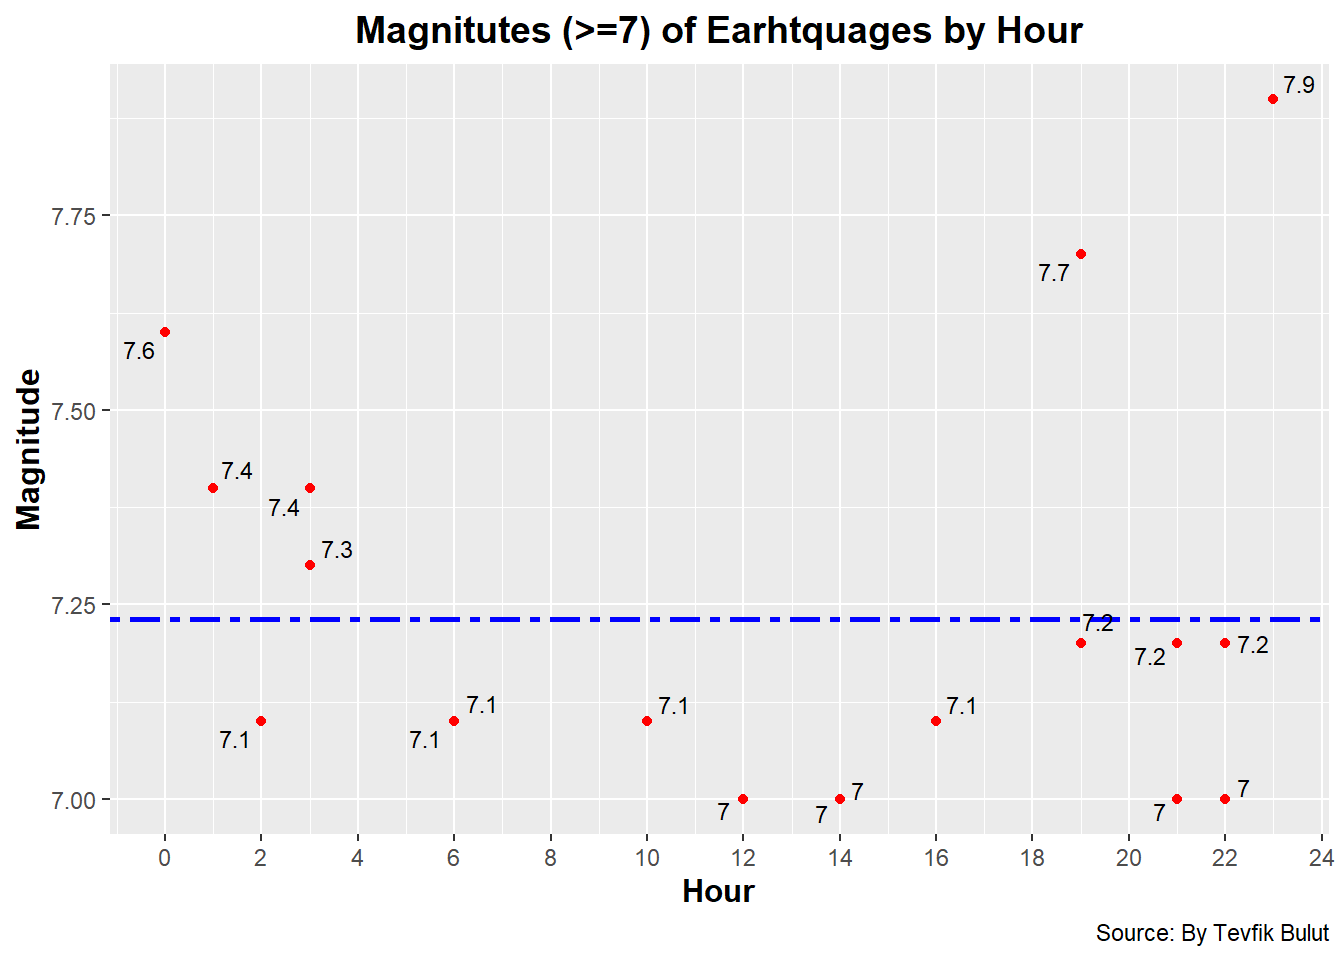
Earthquages of magnitutes (>=7) by hour
h7<-df2 %>% filter(Magnitute>6.99)%>% select(Place, Hour, Magnitute)%>%
  arrange(desc(Magnitute))

h7 %>% ggplot(aes(x=Hour, y=Magnitute))+
 geom_point(col="red")+
  scale_x_continuous(breaks=seq(0, 24, 2))+
   ggtitle("Magnitutes (>=7) of Earhtquages by Hour") +
           xlab("Hour") + ylab("Magnitude")+
  labs(caption = "Source: By Tevfik Bulut")+
  theme(plot.title = element_text(family = "Trebuchet MS", face="bold", size=14, hjust=0.5)) +
theme(axis.title = element_text(family = "Trebuchet MS", face="bold", size=12))+
  geom_hline(yintercept=mean(h7$Magnitute), linetype="twodash", color = "blue", size=1)+
geom_text_repel(aes(label=Magnitute), size=3, data=h7) + theme(legend.position = "None")
Relationship between depth of earthquage and magnitude of earthquage
df2%>%ggplot(aes(Magnitute, Depth))+
geom_point(size=1, col="red")+
   ggtitle("Relationship between depth of earthquage and magnitude of earthquage") +
           xlab("Magnitute") + ylab("Depth")+
  labs(caption = "Source: By Tevfik Bulut")+
  theme(plot.title = element_text(family = "Trebuchet MS", face="bold", size=12, hjust=0.5)) +
theme(axis.title = element_text(family = "Trebuchet MS", face="bold", size=10))+
 geom_vline(xintercept=mean(df2$Magnitute), linetype="twodash", color = "green", size=1)

Density plot of magnitute
ggdensity(df2$Magnitute,
          main = "Density plot of magnitude",
          xlab = "Magnitute")

Density plot of depth
ggdensity(df2$Depth,
          main = "Density plot of depth",
          xlab = "Depth")

QQ plot of magnitute
ggqqplot(df2$Magnitute)

QQ plot of depth
ggqqplot(df2$Depth)
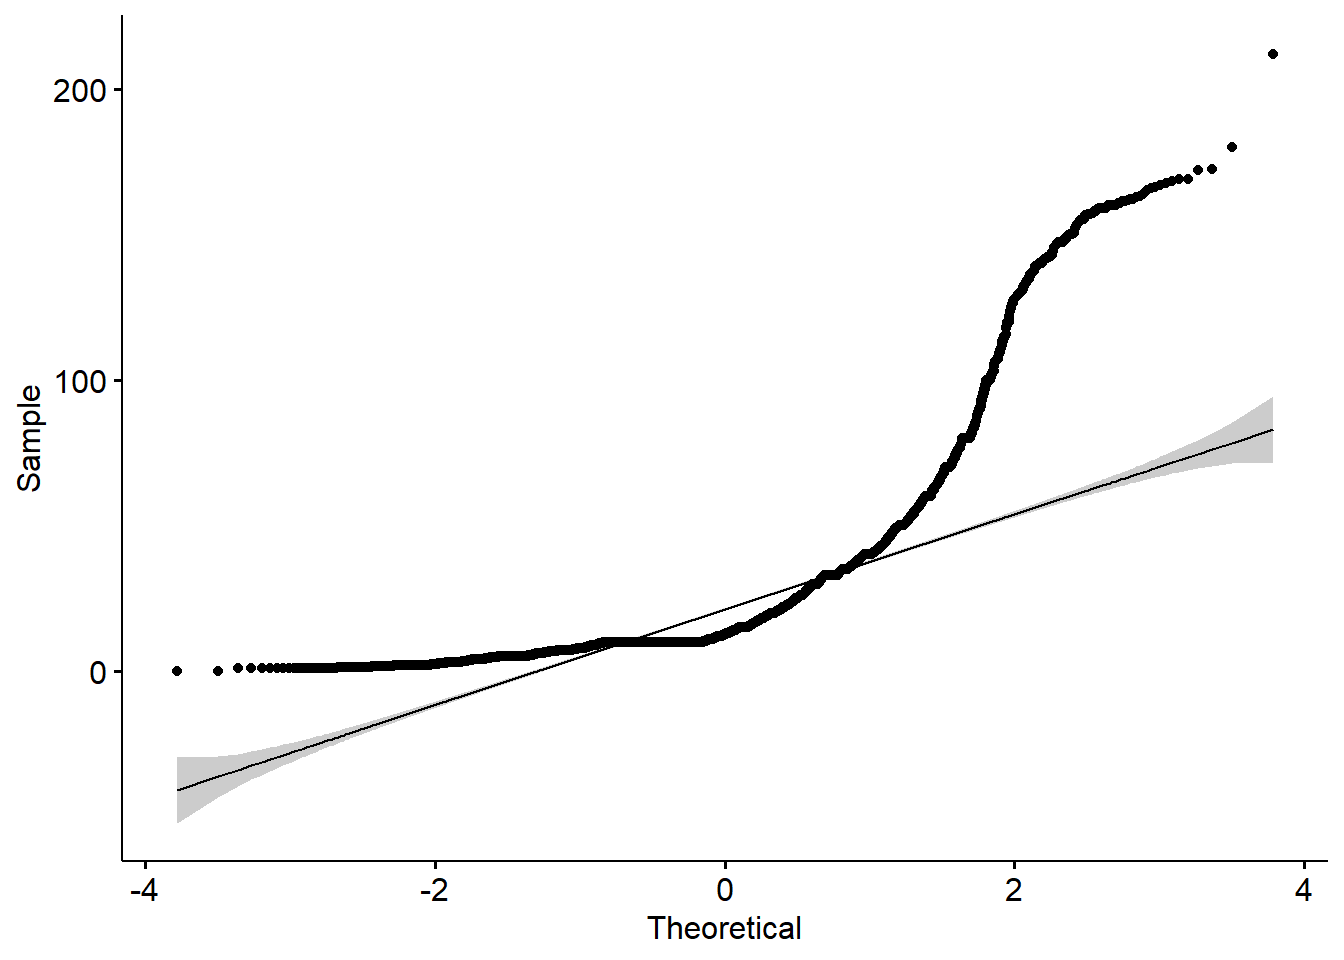
Kolmogorov-Smirnov Normality test
#Kolmogorov-Smirnov test is used in place of Shapiro-Wilk’s one because sample size exceeds 5000.

ks.test(df2$Magnitute, df2$Depth)
##
##  Two-sample Kolmogorov-Smirnov test
##
## data:  df2$Magnitute and df2$Depth
## D = 0.88799, p-value < 2.2e-16
## alternative hypothesis: two-sided
Correlation between depth of earthquage and magnitude of earthquage
ggscatter(df2, x = "Magnitute", y = "Depth",
          add = "reg.line", conf.int = TRUE,
          cor.coef = TRUE, cor.method = "pearson",
          xlab = "Magnitute", ylab = "Depth", main="Correlation between depth of earthquage and magnitude of earthquage")

Correlation Analysis
#There is no strong relationship between depth and manitude
cor.test(df2$Magnitute, df2$Depth,
                    method = "pearson")
##  Pearson's product-moment correlation
##
## data:  df2$Magnitute and df2$Depth
## t = 8.0256, df = 6453, p-value = 1.191e-15
## alternative hypothesis: true correlation is not equal to 0
## 95 percent confidence interval:
##  0.07519906 0.12350870
## sample estimates:
##        cor
## 0.09941246
Hope to create awareness..
I attribute this work to our citizens who died in the earthquake.
References
https://rpubs.com/tevfik1461/Turkey
https://www.afad.gov.tr/
https://www.r-project.org/