The main purpose of the study is to analysis Turkey earthquake data set obtained from Boğaziçi University KOERI Regional Earthquage-Tsunami Monitoring Center online database using data mining techniques. In this way, it is targeted to be created awareness.
Data set includes earthquakes with magnitude between 3.0 and 9.0. Number of observations is 50000, and number of variables is 15. Earthquage data set is consisted of time series from year 1979 to date 2019-10-29. The definitions of the variables in the data set are given below (Boğaziçi University KOERI Regional Earthquage-Tsunami Monitoring Center).
- No: Event Sequence.
- Event ID: Unic ID for event [YYYYMMDDHHMMSS (YearMonthDayHourMinuteSecond)
- Date: Date of event specified in the following format YYYY.MM.DD (Year.Month.Day).
- Origin Time: Origin time of event (UTC) specified in the following format HH:MM:SS.MS (Hour:Minute:Second.Millisecond).
- Latitude: in decimal degrees.
- Longitude: in decimal degrees.
- Depth(km): Depth of the event in kilometers.
- xM: Biggest magnitude value in specified magnitude values (MD, ML, Mw, Ms and Mb).
- MD ML Mw Ms Mb Type: Magnitude types (MD: Duration, ML: Local, Mw: Moment, Ms: Surface wave, Mb: Body-wave). 0.0 (zero) means no calculation for that type of magnitude.
- Location: Nearest settlement.
Exploratory analysis of the earthquake data set is given step by step in the next sections. R programming language is used in the analysis.
Loading Libraries
library(readr)
library(tibble)
library(tidyr)
library(dplyr)
library(lubridate)
library(formattable)
library(ggplot2)
library(ggpubr)
library(formattable)
library(GGally)
library(ggrepel)
library(tidyverse)
library(leaflet)
library(sf)
library(widgetframe)
Loading Data Set
df <- read_delim("data_bogazici.txt",
    "\t", escape_double = FALSE, trim_ws = TRUE)
df<-as_tibble(df)
Classification by Year, Month, Day, Hour, Minute, and Second
df1<-df[,-c(1,2, 14)]
str(df1)
depth<-tibble(Depth= as.numeric(df1$`Der(km)`))
location<-as_tibble(df1[, 12])
year<-tibble(Year=as.integer(substring(df1$`Olus tarihi`,1,4)))
month<-tibble(Month=as.integer(substring(df1$`Olus tarihi`,6,7)))
day<-tibble(Day=as.integer(substring(df1$`Olus tarihi`,9,10)))
hour<-tibble(Hour=as.integer(hour(df1$`Olus zamani`)))
minute<-tibble(Minute=as.integer(minute(df1$`Olus zamani`)))
second<-tibble(Second=as.integer(second(df1$`Olus zamani`)))
df2<-cbind(year, month, day, hour, minute, second, Latitude= as_tibble(df1[,3]),Longitude=as_tibble(df1[,4]), Depth= depth, Magnitute= as_tibble(df1[,6]), Location=location)
head(df2)
df2<-df2 %>% rename(Latitude = Enlem, Longitude=Boylam, Location=Yer, Magnitude=xM)
#Adding column that categorize magnitudes of earthquages
df2<-mutate(df2, Magnitude_Class=cut(df2$Magnitude, breaks=c(2.9, 4, 5, 6, 7, 8), labels=c("3-4", "4-5", "5-6", "6-7", "7-8")))
Classes ‘tbl_df’, ‘tbl’ and 'data.frame':	50000 obs. of  12 variables:
 $ Olus tarihi: chr  "2019.10.29" "2019.10.29" "2019.10.29" "2019.10.27" ...
 $ Olus zamani: 'hms' num  20:48:53 15:38:41 06:36:14 10:18:46 ...
  ..- attr(*, "units")= chr "secs"
 $ Enlem      : num  38.2 40.7 40.7 40.9 39.7 ...
 $ Boylam     : num  42.9 27.4 32.9 28.2 26.4 ...
 $ Der(km)    : chr  "005.0" "003.4" "007.4" "010.8" ...
 $ xM         : num  3 3.3 3.8 3.5 3.2 3 3.5 3.5 3 3.5 ...
 $ MD         : num  0 0 0 0 0 0 0 0 0 0 ...
 $ ML         : num  3 3.3 3.7 3.5 3.1 3 3.5 3.5 3 3.5 ...
 $ Mw         : num  2.9 3.1 3.8 3.3 3.2 2.8 3.4 3.4 2.9 3.4 ...
 $ Ms         : num  0 0 0 0 0 0 0 0 0 0 ...
 $ Mb         : num  0 0 0 0 0 0 0 0 0 0 ...
 $ Yer        : chr  "UNLUCE-BAHCESARAY (VAN) [North East  7.8 km]" "GUZELKOY ACIKLARI-TEKIRDAG (MARMARA DENIZI)" "HACILAR-CERKES (CANKIRI) [North West  4.1 km]" "SILIVRI ACIKLARI-ISTANBUL (MARMARA DENIZI)" ...
 - attr(*, "problems")=Classes ‘tbl_df’, ‘tbl’ and 'data.frame':	2 obs. of  5 variables:
  ..$ row     : int  41487 43525
  ..$ col     : chr  "MD" "Olus zamani"
  ..$ expected: chr  "no trailing characters" "valid date"
  ..$ actual  : chr  "R" "10:03:73.00"
  ..$ file    : chr  "'data_bogazici.txt'" "'data_bogazici.txt'"
 - attr(*, "spec")=
  .. cols(
  ..   No = col_character(),
  ..   `Deprem Kodu` = col_double(),
  ..   `Olus tarihi` = col_character(),
  ..   `Olus zamani` = col_time(format = ""),
  ..   Enlem = col_double(),
  ..   Boylam = col_double(),
  ..   `Der(km)` = col_character(),
  ..   xM = col_double(),
  ..   MD = col_double(),
  ..   ML = col_double(),
  ..   Mw = col_double(),
  ..   Ms = col_double(),
  ..   Mb = col_double(),
  ..   Tip = col_character(),
  ..   Yer = col_character()
  .. )
  Year Month Day Hour Minute Second   Enlem  Boylam Depth  xM
1 2019    10  29   20     48     53 38.1520 42.9158   5.0 3.0
2 2019    10  29   15     38     41 40.7248 27.3940   3.4 3.3
3 2019    10  29    6     36     14 40.7342 32.9457   7.4 3.8
4 2019    10  27   10     18     46 40.8810 28.2057  10.8 3.5
5 2019    10  27    9     17     31 39.6660 26.3607   6.2 3.2
6 2019    10  27    8     18     53 40.8760 28.2063   6.1 3.0
                                                 Yer
1       UNLUCE-BAHCESARAY (VAN) [North East  7.8 km]
2        GUZELKOY ACIKLARI-TEKIRDAG (MARMARA DENIZI)
3      HACILAR-CERKES (CANKIRI) [North West  4.1 km]
4         SILIVRI ACIKLARI-ISTANBUL (MARMARA DENIZI)
5 CAKMAKLAR-AYVACIK (CANAKKALE) [South East  1.4 km]
6         SILIVRI ACIKLARI-ISTANBUL (MARMARA DENIZI)
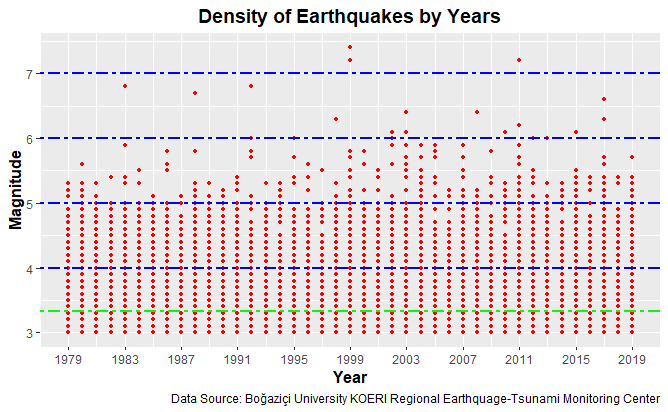
Density of earthquages
df2%>%ggplot(aes(Year, Magnitude))+
geom_point(size=1, col="red")+
   ggtitle("Density of Earthquakes by Years") +
           xlab("Year") + ylab("Magnitude")+
   scale_x_continuous(breaks=seq(min(df2$Year),max(df2$Year), 4)) +
   labs(caption = "Data Source: Boğaziçi University KOERI Regional
        Earthquage-Tsunami Monitoring Center")+
   theme(plot.title = element_text(family = "Trebuchet MS", face="bold",
         size=14, hjust=0.5)) +
   theme(axis.title = element_text(family = "Trebuchet MS", face="bold",
         size=12))+
   geom_hline(yintercept=mean(df2$Magnitude), linetype="twodash", color =
              "green", size=1)+
   geom_hline(yintercept=4, linetype="twodash", color = "blue", size=1)+
   geom_hline(yintercept=5, linetype="twodash", color = "blue", size=1)+
   geom_hline(yintercept=6, linetype="twodash", color = "blue", size=1)+
   geom_hline(yintercept=7, linetype="twodash", color = "blue", size=1)
Number of earthquakes by years
year<-df2 %>% group_by(Year) %>% tally()
formattable (year)
year%>%ggplot(aes(Year, n))+
geom_line(size=1, col="red")+
  scale_x_continuous(breaks=seq(min(year$Year),max(year$Year), 10))+
   ggtitle("Number of Earthquakes by Years") +
           xlab("Year") + ylab("Number of Cases")+
  labs(caption = "Data Source: Boğaziçi University KOERI Regional Earthquage-Tsunami Monitoring Center")+
  theme(plot.title = element_text(family = "Trebuchet MS", face="bold", size=14, hjust=0.5)) +
theme(axis.title = element_text(family = "Trebuchet MS", face="bold", size=12))+
 geom_hline(yintercept=mean(year$n), linetype="twodash", color = "green", size=1)

Density of earthquakes by years
df2%>%ggplot(aes(Year, Magnitude, col=Magnitude_Class))+
geom_point(size=1)+
  geom_jitter()+
  facet_grid(Magnitude_Class~., scale="free")+
   ggtitle("Density of Earthquakes of by Years") +
           xlab("Year") + ylab("Magnitude")+
  labs(caption = "Data Source: Boğaziçi University KOERI Regional Earthquage-Tsunami Monitoring Center")+
  theme(plot.title = element_text(family = "Trebuchet MS", face="bold", size=12, hjust=0.5)) +
theme(axis.title = element_text(family = "Trebuchet MS", face="bold", size=10))

Number of Earthquakes by Categories
year<-df2 %>% group_by(Year, Magnitude_Class) %>% tally()
formattable (year)
year%>%ggplot(aes(Year, n))+
geom_point(size=1, col="red")+
  facet_wrap(~Magnitude_Class,  ncol=2, scales="free")+
   ggtitle("Number of Earthquakes by Categories") +
           xlab("Year") + ylab("Number of Cases")+
  labs(caption = "Data Source: Boğaziçi University KOERI Regional Earthquage-Tsunami Monitoring Center")+
  theme(plot.title = element_text(family = "Trebuchet MS", face="bold", size=14, hjust=0.5)) +
theme(axis.title = element_text(family = "Trebuchet MS", face="bold", size=12))

The number of categories of earthquakes
year<-df2 %>% group_by(Magnitude_Class) %>% tally()
formattable (year)
year%>%ggplot(aes(Magnitude_Class, n))+
geom_point(size=1, col="red")+
  facet_grid(~Magnitude_Class)+
   ggtitle("Number of Earthquakes by Categories") +
           xlab("Categories of Earthquakes") + ylab("Number of Cases")+
  labs(caption = "Data Source: Boğaziçi University KOERI Regional Earthquage-Tsunami Monitoring Center")+
  theme(plot.title = element_text(family = "Trebuchet MS", face="bold", size=14, hjust=0.5)) +
theme(axis.title = element_text(family = "Trebuchet MS", face="bold", size=12))+
  geom_text_repel(aes(label=n), size=3, data=year) + theme(legend.position = "None")

Number of Cases by Months
month<-df2 %>% group_by(Month) %>% tally()
month<-month %>% select(Month, n)%>%
  arrange(desc(n))
month
month %>% ggplot(aes(Month, n))+
geom_line(size=1, col="brown")+
  scale_x_continuous(breaks=seq(1, 12, 1))+
   ggtitle("Number of Cases by Months") +
           xlab("Month") + ylab("Number of Cases")+
  labs(caption = "Source: Data Source: Boğaziçi University KOERI Regional Earthquage-Tsunami Monitoring Center")+
  theme(plot.title = element_text(family = "Trebuchet MS", face="bold", size=14, hjust=0.5)) +
theme(axis.title = element_text(family = "Trebuchet MS", face="bold", size=12))+
  geom_hline(yintercept=mean(month$n), linetype="twodash", color = "red", size=1)

Number of Cases by Months and Categories
f2<-mutate(df2, Magnitude_Class=cut(df2$Magnitude, breaks=c(2.9, 5, 6, 8), labels=c("3-5", "5-6", "6-8")))
m<-df2 %>% group_by(Month, Magnitude_Class) %>% tally()
formattable (m)
m %>% ggplot(aes(Month, n))+
geom_point(size=1, col="red")+
   ggtitle("Number of Earthquakes by Categories") +
  scale_x_continuous(breaks=seq(1, 12, 1))+
           xlab("Month") + ylab("Number of Cases")+
  labs(caption = "Data Source: Boğaziçi University KOERI Regional Earthquage-Tsunami Monitoring Center")+
  theme(plot.title = element_text(family = "Trebuchet MS", face="bold", size=14, hjust=0.5)) +
theme(axis.title = element_text(family = "Trebuchet MS", face="bold", size=12))+
  geom_text_repel(aes(label=n), size=3, data=m) + theme(legend.position = "None")+
   facet_grid(Magnitude_Class~.)

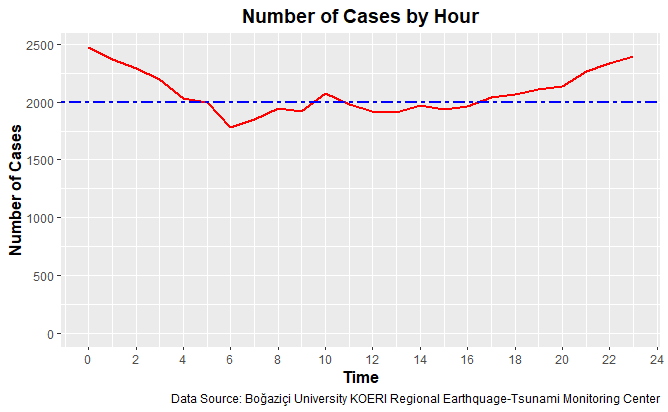
Number of Earthquakes by Hour
hour<-df2 %>% group_by(Hour) %>% tally()
hour<-hour %>% select(Hour, n)%>%
      arrange(desc(n))
hour %>% ggplot(aes(Hour, n))+
geom_line(size=1, col="red")+
  scale_x_continuous(breaks=seq(0, 24, 2))+
   ggtitle("Number of Cases by Hour") +
           xlab("Time") + ylab("Number of Cases")+
  labs(caption = "Data Source: Boğaziçi University KOERI Regional Earthquage-Tsunami Monitoring Center")+
  theme(plot.title = element_text(family = "Trebuchet MS", face="bold", size=14, hjust=0.5)) +
theme(axis.title = element_text(family = "Trebuchet MS", face="bold", size=12))+
  geom_hline(yintercept=mean(hour$n), linetype="twodash", color = "blue", size=1)
Number of Earthquakes by Categories and Hour
h<-df2 %>% group_by(Hour, Magnitude_Class) %>% tally()
h%>%ggplot(aes(Hour, n))+
geom_point(size=1, col="red")+
  facet_wrap(~Magnitude_Class,  ncol=2, scales="free")+
   ggtitle("Number of Earthquakes by Categories") +
           xlab("Time") + ylab("Number of Cases")+
  labs(caption = "Data Source: Boğaziçi University KOERI Regional Earthquage-Tsunami Monitoring Center")+
  theme(plot.title = element_text(family = "Trebuchet MS", face="bold", size=14, hjust=0.5)) +
theme(axis.title = element_text(family = "Trebuchet MS", face="bold", size=12))

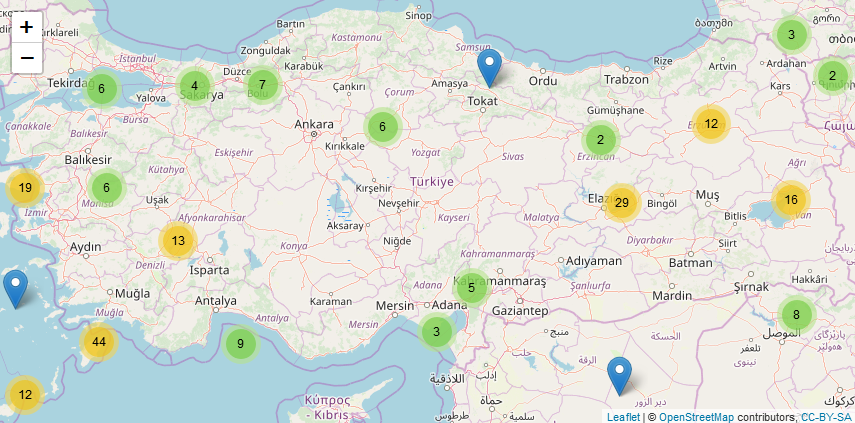
Map of the earthquages with magnitudes between 5.0 and 6.0
(y <- df2 %>%
  filter(`Magnitude_Class` == "5-6"))
leaflet() %>%
  addTiles() %>%
  addMarkers(data = y, clusterOptions = markerClusterOptions())
Map of the earthquages with magnitudes between 6.0 and 8.0
(y <- df2 %>%
  filter(`Magnitude_Class` == "6-8"))
leaflet() %>% addTiles() %>%
  addCircleMarkers(data=y,
    label=y$Magnitude,
    labelOptions = labelOptions(noHide = T, direction = 'top'))

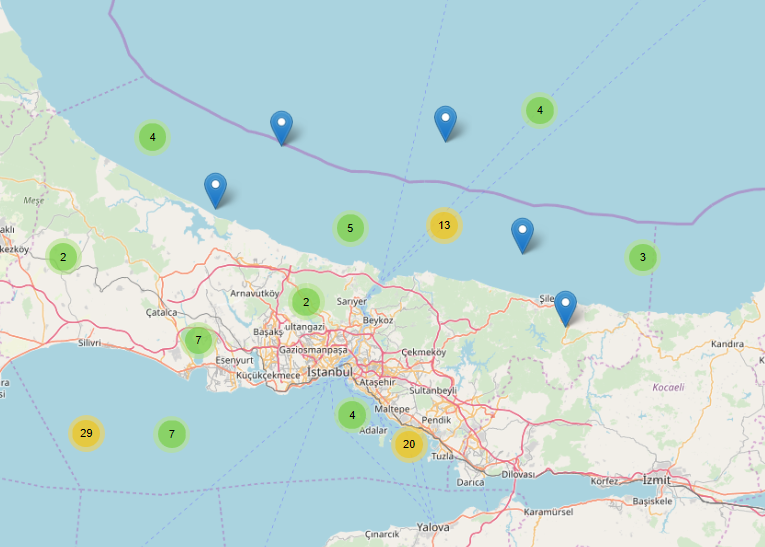
Earthquages of İstanbul City
istanbul<-df2 %>% filter(str_detect(Location, "ISTANBUL"))
leaflet() %>%
  addTiles() %>%
  addMarkers(data = istanbul, clusterOptions = markerClusterOptions())
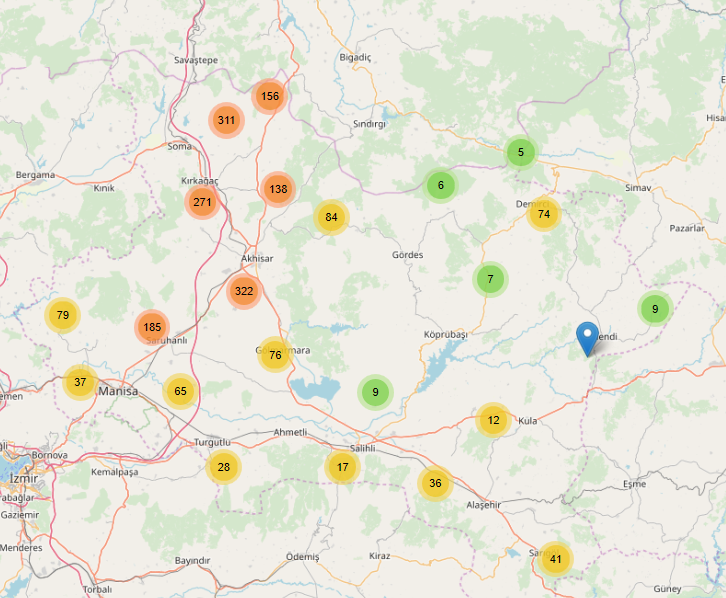
Earthquages of Manisa City
manisa<-df2 %>% filter(str_detect(Location, "MANISA"))
leaflet() %>%
  addTiles() %>%
  addMarkers(data = Manisa, clusterOptions = markerClusterOptions())
Earthquages of Elazığ City
elazıg<-df2 %>% filter(str_detect(Location, "ELAZI"))
leaflet() %>%
  addTiles() %>%
  addMarkers(data = elazıg, clusterOptions = markerClusterOptions())

Density plot of magnitute
ggdensity(df2$Magnitude,
          main = "Density plot of magnitude",
          xlab = "Magnitute")

Density plot of depth
ggdensity(df2$Depth,
          main = "Density plot of depth",
          xlab = "Depth")

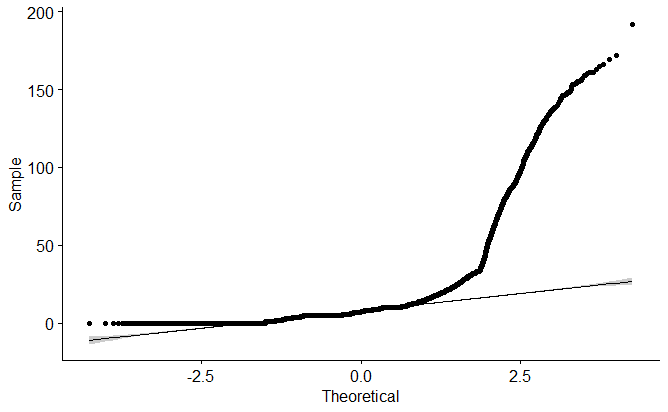
QQ plot of magnitute
ggqqplot(df2$Magnitude)

QQ plot of depth
ggqqplot(df2$Depth)
Kolmogorov-Smirnov Normality test
#Kolmogorov-Smirnov test is used in place of Shapiro-Wilk’s one because sample size exceeds 5000.
ks.test(df2$Magnitude, df2$Depth)
p-value will be approximate in the presence of ties
	Two-sample Kolmogorov-Smirnov test
data:  df2$Magnitude and df2$Depth
D = 0.8073, p-value < 2.2e-16
alternative hypothesis: two-sided
Correlation between depth of earthquage and magnitude of earthquage
ggscatter(df2, x = "Magnitude", y = "Depth",
          add = "reg.line", conf.int = TRUE,
          cor.coef = TRUE, cor.method = "pearson",
          xlab = "Magnitute", ylab = "Depth", main="Correlation between depth of earthquage and magnitude of earthquage")

Correlation Analysis
#There is no strong relationship between depth and magnitude
cor.test(df2$Magnitude, df2$Depth,
                    method = "pearson")
	Pearson's product-moment correlation
data:  df2$Magnitude and df2$Depth
t = 33.943, df = 49998, p-value < 2.2e-16
alternative hypothesis: true correlation is not equal to 0
95 percent confidence interval:
 0.1415024 0.1586381
sample estimates:
      cor
0.1500815
Conclusion
In this study, it is aimed to be conducted exploratory data analysis of Turkey earthquages using data mining techniques. From descriptive statistics, it is understood that earthquakes often show up at night and in the evening. It is observed that the eartquages with magnitudes ranging from 5.0 to 8.0 are more intense in ones between 10th and 12th months relative to other months.
The findings show that there is no strong correlation between depth of earthquages and magnitude of earthquages. Factors such as soil and rock structure may have affected this relationship. In addition, these factors need to be evaluated.
Hope to create awareness..
I attribute this work to our citizens who died in the earthquake.
References
https://rpubs.com/tevfik1461/Turkey
https://tevfikbulut.com/2020/01/31/exploratory-data-analysis-of-turkey-earthquakes/
https://www.r-project.org/
https://cfss.uchicago.edu/notes/raster-maps-with-ggmap/
http://www.koeri.boun.edu.tr/sismo/zeqdb/indexeng.asp
http://www.koeri.boun.edu.tr/sismo/zeqdb/